Click on the television or use this link to view this episode of the Lecture Series
-----------------------------------------------------------------------------------------------------------------------------------------
During the lesson the learner will:
1: Review the instructions for this lesson.
2: Read Chapter 2 of the textbook. There is also some material for download that may help reinforce the concepts.
3: Download the study questions. These do not have to be completed but are for your information only.
4: Watch the video lesson located on YouTube about descriptive statistics. It is part 1 of a 3-part series. The videos are kept short to make viewing more enjoyable.
5: Watch part 2 of the video series on descriptive statistics.
6: Watch part 3 of the video series on descriptive statistics.
7: Watch the video that demonstrates how to use Excel to determine descriptive statistics.
8: Watch the video that demonstrates how to find the MEAN using Excel.
9: Watch the video that demonstrates how to sort data in Excel. It is imperative that you master this concept since you will need to sort data throughout the course.
10: Watch the video that demonstrates how to compute the mean of means using Excel.
11: Watch the video that demonstrates the use of Excel functions to compute descriptive statistics. The following are illustrated: COUNT, SUM, AVERAGE, MAX, MIN, MODE, and MEDIAN. There is an attached document that may be used as a guide also. These functions are particularly valuable if you don't have access to the Data Analysis add-in in Excel.
-----------------------------------------------------------------------------------------------------------------------------------------
Read Chapter 2 of the textbook
Caldwell, S. (20xx). Statistics Unplugged. Thomson Wadsworth: Belmont, California.
The free Illowsky text provides more information about descriptive statistics.
-----------------------------------------------------------------------------------------------------------------------------------------
The Study Questions are for review only. They do not have to be completed and submitted as an assignment. Answers to selected questions may be given. Click here to download the Study Questions file
-----------------------------------------------------------------------------------------------------------------------------------------
In this video Dr. Bounds will provide an introduction to descriptive statistics and measures of central tendency including the mean, median, mode and range.
Click on the television or use this link to view this episode of the Lecture Series
-----------------------------------------------------------------------------------------------------------------------------------------
In this video Dr. Bounds will continue an overview of descriptive statistics.
Click on the television or use this link to view this episode of the Lecture Series
-----------------------------------------------------------------------------------------------------------------------------------------
In this video Dr. Bounds will continue with a discussion of descriptive statistics.
Click on the television or use this link to view this episode of the Lecture Series
-----------------------------------------------------------------------------------------------------------------------------------------
In this video Dr. Bounds will demonstrate how to use Excel to find descriptive statistics for a set of data.
Click on the television or use this link to view this episode of the Lecture Series
-----------------------------------------------------------------------------------------------------------------------------------------
In this video Dr. Bounds will demonstrate how to use Excel to find the mean of a set of data.
Click on the television or use this link to view this episode of the Lecture Series
-----------------------------------------------------------------------------------------------------------------------------------------
In this video Dr. Bounds will demonstrate how to sort data in Excel. It is imperative that you master this concept since you will need to sort data throughout the course.
Click on the television or use this link to view this episode of the Lecture Series
-----------------------------------------------------------------------------------------------------------------------------------------
In this video Dr. Bounds will provide an example of how to use Excel to compute the mean of means when analyzing certain survey data.
Click on the television or use this link to view this episode of the Lecture Series
-----------------------------------------------------------------------------------------------------------------------------------------
In this video Dr. Bounds will discuss the use of Excel functions to compute descriptive statistics. The following are illustrated: COUNT, SUM, AVERAGE, MAX, MIN, MODE, and MEDIAN. There is a document that may be used as a guide also. Click here to download the document. These functions are particularly valuable if you don't have access to the Data Analysis add-in in Excel.
Click on the television or use this link to view this episode of the Lecture Series
-----------------------------------------------------------------------------------------------------------------------------------------
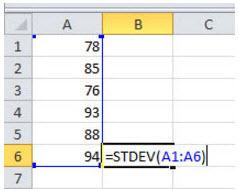
The standard deviation function in Excel: =STDEV(start:end)
-----------------------------------------------------------------------------------------------------------------------------------------
This video demonstrates how data can be scrambled and become totally useless if you do not properly select the data to be sorted.
Click on the television or use this link to view this episode of the Lecture Series
-----------------------------------------------------------------------------------------------------------------------------------------